It’s been a long time coming, but it takes a while to count votes! Nearly a month ago people throughout Orange County cast their votes for the OC Registrar to tally up. If you weren’t registered to vote and you cast a ballot anyway, those votes were sadly not counted (don’t let it happen again, REGISTER TO VOTE HERE! : http://savenewport.com/vote)
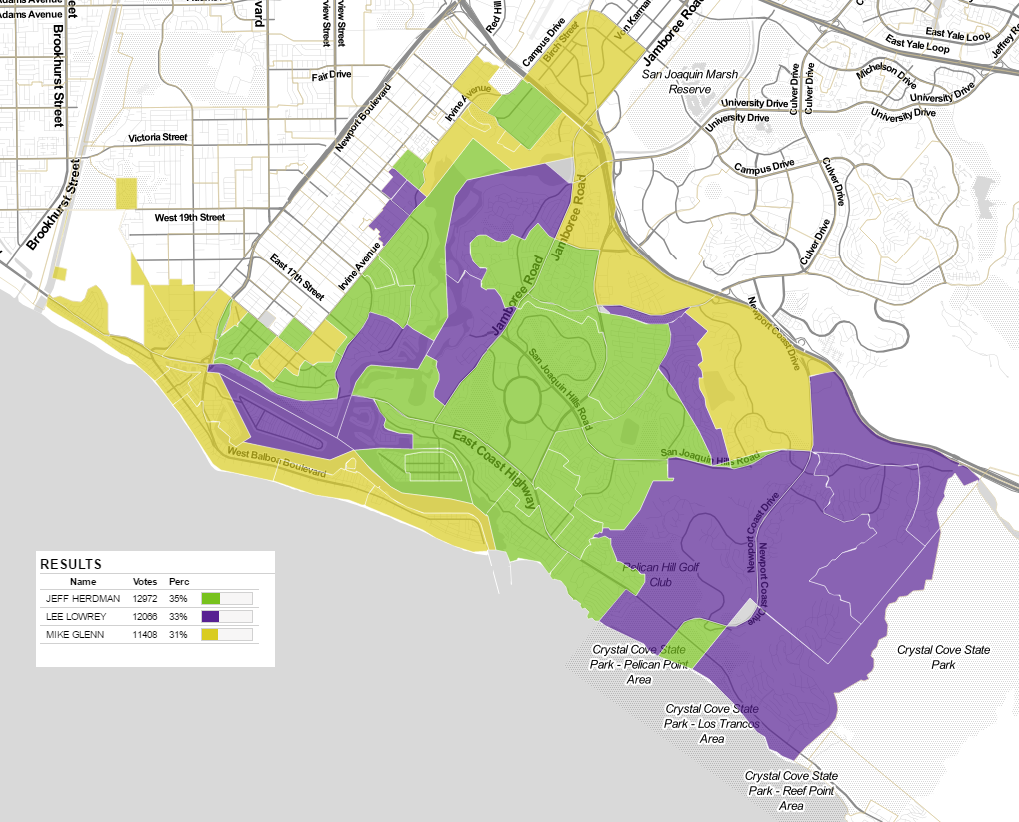
Here is how the voting map looked for District 5:

Assuming a positive outcome of the peninsula, I spent my time walking and knocking on doors in other neighborhoods, (where it obvious by the map). I admit that not walking a single home in the district I’ve lived in for a dozen years was terrifying, but our friends, neighbors, and businesses all pulled through to secure the area– THANK YOU! With that time saved, I was also able to capture the northernmost sections of our city, which you can clearly see on the map.
Including PACs and campaign money, this is how we stack up with the competitors when it comes down to cost per vote:
| MG | LL | JH | |
| PERCENT | 31.3% | 33.1% | 35.6% |
| VOTES | 11,428 | 12,073 | 12,986 |
| CASH | $30,168 | $175,829 | $82,366.61 |
| COST/VOTE | $2.63 | $14.56 | $6.34 |
* NOTE: We don’t know how much political parties like the Republican and Democrat parties spent, nor do we know the total number of dollars spent in polling hit pieces, as one is labeled in a hodgepodge for all of OC as “Party-building” and the other one isn’t reportable because it’s considered “information gathering”, but we do know that polling costs about $22k from the oft-used parties, so the total is *at least* $100k higher. This would mean that I was outspent by 11.5 times– quite a lot of money to spend for a job that pays about $700/mo after taxes!
So how did Newport stack up against the rest of OC, the State, and the USA? Check out the data, below:
| Newport | OC | California | USA | |
| President | Trump @54.4% | Hillary @ 50.9% | Hillary @61.7% | Hillary @50.8% (Trump wins Electoral) |
| US Senate | Harris @57.9% | HARRIS @53.3% | Harris @62.3% | NA |
| US Congress | Rohrabacher @66.8% | ROHRABACHER @58.3% | NA | NA |
| State Senate | Moorlach @70.01 | MOORLACH @57.0% | NA | NA |
| State Assembly | Harper @68.6% | HARPER @56.2% | NA | NA |
| Prop. 51 – K–12 And Community College Funding Bond | NO @57.6% | YES @49% | YES @55% | NA |
| Prop. 52 – Private Hospital Fees For Medi-Cal | YES @63.1% | YES @67.2% | YES @70% | NA |
| Proposition 53 – Voter Approval of Revenue Bonds | YES @57.6% | YES @57.1% | NO @51% | NA |
| Proposition 54 – Legislation and Proceedings and the Legislature | YES @73.8% | YES @69.8% | YES @65% | NA |
| Proposition 55 – Tax Extension for Education and Healthcare | NO @66.2% | YES @53.9% | YES @73% | NA |
| Proposition 56 – Cigarette Tax | YES @59.8% | YES @60.9% | YES @64% | NA |
| Proposition 57 – Juvenile Criminal Proceedings and Sentencing | YES @59.99% | YES @58.0% | YES @64% | NA |
| Proposition 58 – English Language Education | YES @62.5% | YES @60.2% | YES @74% | NA |
| Proposition 59 – Campaign Finance: Voter Instruction | NO @59.5% | NO @53.4% | YES @53% | NA |
| Proposition 60 – Adult Film Condom Requirements | NO @60.80% | NO @53.4% | NO @54% | NA |
| Proposition 61 – State Prescription Drug Purchase Standards | NO @60.79% | NO @55.6% | NO @53% | NA |
| Proposition 62 – Death Penalty Elimination | NO @62.4% | YES @60.2% | NO @53% | NA |
| Proposition 63 – Firearms and Ammunition Sales | YES @57.0% | YES @59.5% | YES @37% | NA |
| Proposition 64 – Marijuana Legalization | YES @53% | YES @52.0% | YES @57% | NA |
| Proposition 65 – Carry-out Bag Charges | NO @57.9% | NO @56.9% | NO @54% | NA |
| Proposition 66 – Changes Death Penalty Procedures | YES @71.4% | YES @59.1% | YES @51% | NA |
| Proposition 67 – Ban on Single-use Plastic Bags | NO @58.2% | NO @56.9% | YES @53% | NA |
| City Council | Brad Avery @ 58.3% Jeff Herdman @ 35.6% Will O’Neill @ 49.9% |
NA | NA | NA |
| City Measure MM (tax increase restrictions) | YES @ 81.2% | NA | NA | NA |
 Save Newport Real News in Newport Beach


