 Save Newport Real News in Newport Beach


Friday, the Registrar of Voters officially ended the vote count, having counted all votes from Provisional Ballots, Conditional Ballots, election day Paper Ballots, in-poll ballot results, and various forms of Vote by Mail– and what a whopper of results they were!
The Registrar of Voters stated: “Total turnout from the election was 71% with 44.2% of voters casting their ballot by mail, 25.2% casting their ballot in a polling place, and 1.5% casting their ballot in an Early Vote Center. This is the highest turnout midterm election in Orange County, CA since 1970, when turnout was 76.3%.
Turnout in neighboring counties south of Santa Barbara had lower voter turnout compared to Orange County:
Santa Barbara: 67.2%
Kern: 54.5%
Ventura: 68.8%
Los Angeles: 57.3%
San Bernardino: 57.6%
Riverside: 54.9%
San Diego: 64.4%
Imperial: 47.9%“
As you can see, the “Get out the Vote” efforts in Orange County definitely worked. But who did they work for? Here are the results, countywide:
Every single seat going to DC that was held by a Republican was lost, turning this 2016 OC Congressional map completely blue: 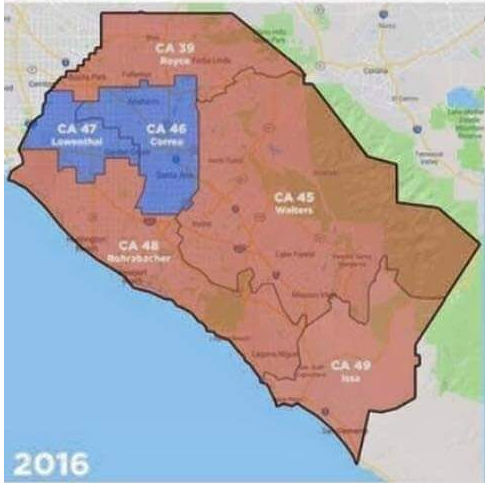
And leaving OC without any Republican representation in Washington, DC. Newport also lost Republican darling Matt Harper as its state assemblyman.
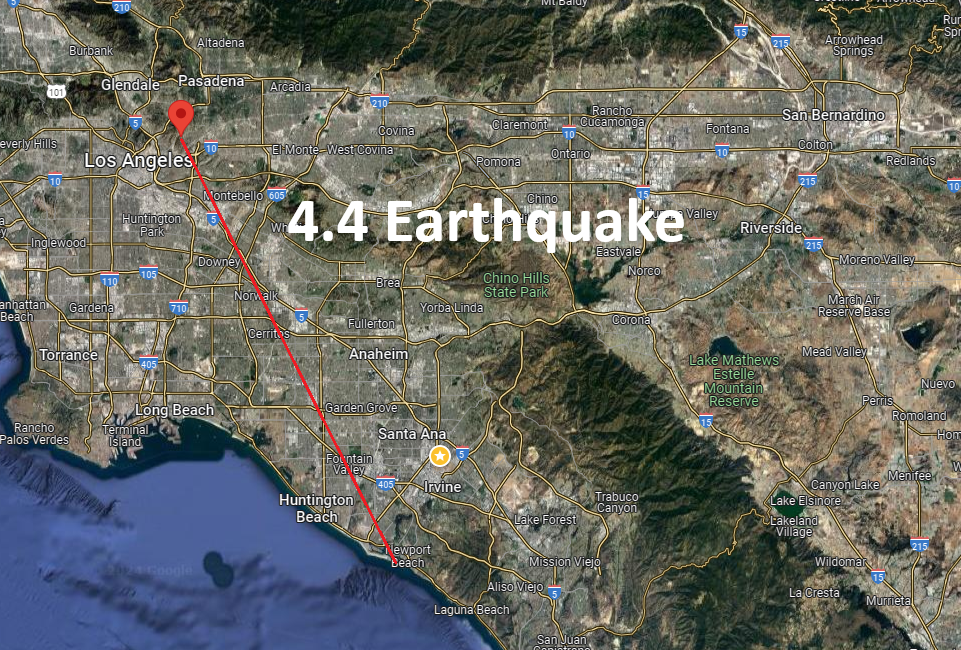
In Newport Beach, the Provisional Ballots brought Tim Stoaks, who ran against Duffy, a defeat by just 36 votes. Stoaks led Duffy from election day until about 4 days before the election was finalized, when Duffy pulled ahead by just a few dozen votes. A huge reminder that every vote really does count.
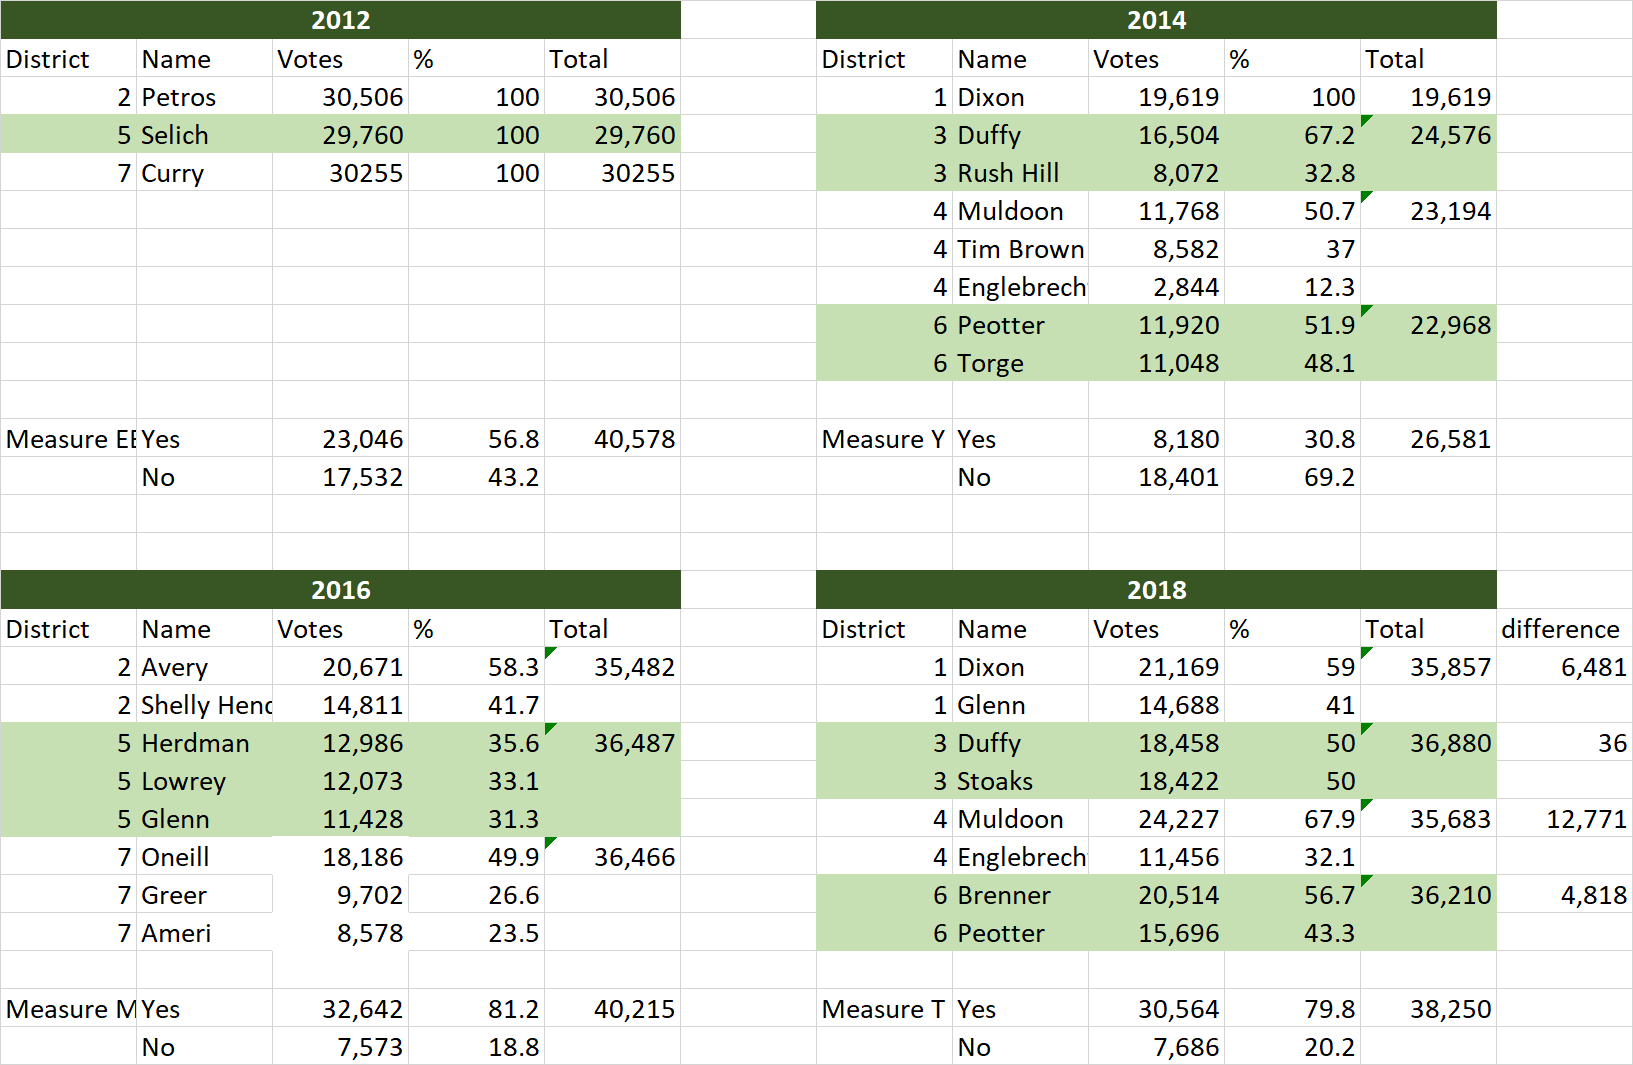
So how’d the other races in Newport shape up? Here’s a graphic along with the two three previous cycles so you can compare the off-years vs the presidential years, which typically have better turnout. As you can see, the 2018 election surpassed the previous off-year (2014) election by an astounding amount, coming in 43% higher– and only 5% lower than the presidential year (2016).
Races to note:
1) Peotter, who won by a few hundred votes in 2014 (while losing his district) lost handedly to Brenner, who took him on after a failed recall attempt against Peotter. This resulted in Peotter in a never-ending election cycle for about a full year and a half (the recall began in April 2017). Campaigns supporting Peotter sent out mailers filled with lies against Joy.
2) Dixon won against me, but lost a whopping 41% of the vote. Note that I was involved in a bicycle accident which prevented me from walking for most of the campaign, spent only about $800 on “Mike Glenn” signs, and filed to run on the very last day, at the very last hour. Dixon sent out campaign mailers filled with lies on her own dime in order to secure a victory, spending about $100k to defend her votes versus an opponent who spent $800. Notably, she lost the entirety of the Balboa So-Called-“Trolley” route– what she considers her crowning achievement.
3) Duffy, a name known with a smile throughout Newport, couldn’t distance himself from Peotter, and looked like he was going to lose his race all the way up until last Tuesday. In the end, he pulled through– but this could prove to be the most interesting race of all. With a margin of victory of only 36 votes, emails have been aflurry about doing a recount. I spoke to Tim Stoaks about this and he informed me that he was not a part of the recount effort being promoted by a grassroots group, and since it hasn’t even begun yet, said that he would decline commenting on mere rumors… but I think this race is not yet over.
4) Muldoon won by a landslide, despite the support widespread of SPON.
5) The only person who seemed to be against Measure T– which required a public vote before dropping more than $50m in debt on the city– was Keith Curry. Keith’s word alone apparently was enough to sway 20% of the vote, which is a huge number in and of itself.
Due to filing deadlines being so far out, we won’t officially know until the end of July how much each candidate spent on the elections– but as soon as that info comes out, we will do what we always do and let you know not just how much was used to sway these elections, but also we will name the names of who the donors for each candidate are.
Every year, ballots are thrown out because signatures don’t match or there are multiple ballots cast for the same person. You can check out your own ballot and make sure it was counted, here: https://www.ocvote.com/registration/verify-your-voter-registration/?page_heading=track
Other votes (like ballot measures) can be found here: https://www.ocvote.com/fileadmin/live/gen2018/results.htm#c-2067 but keep in mind, these are just how the COUNTY voted on those, and statewide measures take in the results of all counties– but it is interesting to see how OC compared. You can see the statewide results, here: https://vote.sos.ca.gov/
In the meantime, I think the www.dumpdixon.com website gave people a wakeup call to how our politicians are voting. I look forward to continuing to be a voice in the community for reasonable and rational government,